

PostgreSQL Connection Management: Lifecycle, Capacity, and Pooling
From Client Request to Backend Process: Session State, max_connections & Two-Tier Pooling
Comprehensive technical guide to PostgreSQL connection lifecycle, active/idle/idle-in-transaction overhead, max_connections boundaries, two-tier application pool and PgBouncer integration, prepared statements, and safe sizing.
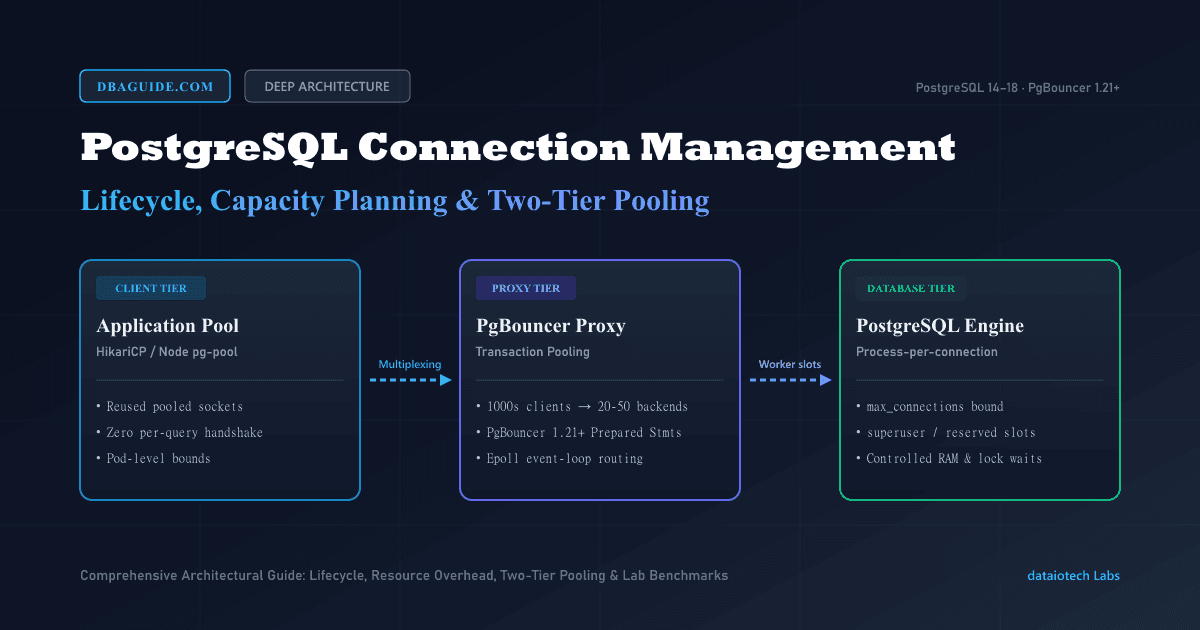
PostgreSQL Connection Management: Lifecycle, Capacity, and Pooling
Category: PostgreSQL · Deep Architecture · Connection & Resource Management Technical Level: Advanced / Expert Read Time: 20–25 minutes Architecture Documentation Scope: PostgreSQL 14–18 Released Versions · PgBouncer 1.21+ Empirically Verified Container Laboratory: PostgreSQL 17.11 (Alpine Linux) · PgBouncer 1.26.1
1. Introduction: Why Connection Management Is an Architectural Decision
One of the most persistent misconceptions in database reliability engineering is treating connection capacity merely as a single configuration setting (max_connections). When traffic spikes or microservice instances scale horizontally and applications encounter connection rejection errors, engineering teams reflexively bump this value from 100 to 500 or 1,000.
However, PostgreSQL is not a multi-threaded database engine. It operates on a process-per-connection architecture, delegating each connected client to an isolated operating system process.
Arbitrarily inflating connection limits does not eliminate throughput bottlenecks. It simply transfers the point of failure from PostgreSQL's connection ceiling to the Linux kernel's CPU scheduler, virtual memory subsystem, and shared memory lock managers.
This deep-dive architectural guide explores the complete journey from an application socket to a PostgreSQL backend process, the concrete overhead of active, idle, and idle-in-transaction states, max_connections and reserved slot mechanics, the complementary synergy between application connection pools and PgBouncer, and verified empirical metrics gathered in an isolated container laboratory.
2. From Client Request to Backend Process: Connection Lifecycle
When a client application (Node.js, Go, Java Spring, Python FastAPI) issues a query to PostgreSQL, the operation traverses four distinct architectural boundaries: Connection, Session, Transaction, and Query.
▸2.1 Connection, Session, Transaction, and Statement Boundaries
| Concept | Architectural Layer | Lifecycle Boundary | Primary Resource Consumption |
|---|---|---|---|
| Connection (Socket) | OS / Transport Layer | Initiated via TCP 3-way handshake and TLS negotiation; terminated via TCP FIN/RST. | File descriptors, Linux kernel TCP socket buffers (tcp_rmem, tcp_wmem). |
| Session | PostgreSQL Core Engine | Instantiated upon successful authentication; persists until the client disconnects. | Dedicated OS backend process, private virtual memory (relcache, catcache), session GUCs, temporary tables. |
| Transaction | Storage & MVCC Engine | Demarcated by BEGIN and COMMIT / ROLLBACK. Snapshot is acquired upon the first statement (or SET TRANSACTION SNAPSHOT). Real 32-bit XID is only allocated upon first data modification (INSERT/UPDATE/DELETE) or explicit write lock; read-only transactions use virtual XIDs (VirtualTransactionId). | Table and row locks (pg_locks), WAL buffers, active transaction slot, snapshot memory. |
| Query (Statement) | Executor Engine | Begins when an SQL string arrives; concludes when result tuples are transmitted to the client. | CPU cores, work_mem (sorting/hash joins), buffer cache accesses, physical storage I/O. |
▸2.2 Process-per-Connection Architecture and fork() Overhead
The primary daemon in PostgreSQL, Postmaster, listens on TCP port 5432. Upon accepting an incoming client connection, Postmaster issues a fork() system call to instantiate an isolated backend process:
- 1Network & Handshake Overhead: TCP 3-way handshake plus TLS 1.3 negotiation typically incurs 5–15 ms of network round-trip latency.
- 2Linux fork() & Page Table Duplication: Although Linux utilizes Copy-on-Write (CoW), duplicating page tables for processes with large virtual memory maps introduces measurable CPU overhead.
- 3Catalog Cache Population: Each newly spawned backend must populate its private catalog caches (
relcacheandcatcache) by reading system catalogs.
3. Session States and Concrete Resource Overhead
PostgreSQL exposes the real-time operational state of every backend process via the pg_stat_activity catalog view. Understanding these states is critical for root-cause diagnosis.
▸3.1 Four Essential Session States
- 1`active`: The backend is actively executing a client request. It is either consuming CPU cycles, performing storage I/O, waiting on an IPC lock, or streaming results across the network.
- 2`idle`: The TCP socket remains open and the session is authenticated, but the client is not currently executing an SQL command. The process is waiting for the next request.
- 3`idle in transaction`: The client issued
BEGIN, executed one or more statements, but has not yet calledCOMMITorROLLBACK. This is the most dangerous state in production OLTP systems! - 4`idle in transaction (aborted)`: An error occurred within the transaction block, but the client application has not yet executed a
ROLLBACKto reset the connection.
-- Inspect real-time state distribution across client backends
SELECT
    state,
    count(*) AS session_count,
    round(100.0 * count(*) / sum(count(*)) OVER (), 1) AS ratio_pct
FROM pg_stat_activity
WHERE backend_type = 'client backend'
GROUP BY state
ORDER BY session_count DESC;▸3.2 Why "Idle in Transaction" Threatens System Health
When an application transaction begins and subsequently invokes an external synchronous dependency (such as a third-party payment gateway or HTTP webhook), the database backend remains in the idle in transaction state until that external call completes.
The architectural consequences are severe:
- •Snapshot Retention & Table Bloat: The backend holds its MVCC snapshot open, preventing
VACUUMfrom sweeping dead tuples modified after the snapshot's horizon. This triggers rapid table and index bloat across high-churn tables. - •Lock Contention: Any row-level or table-level locks acquired during earlier statements remain held, queuing subsequent queries behind lock trees.
- •Capacity Exhaustion: The dormant process continues occupying a dedicated slot in
max_connections.
idle_in_transaction_session_timeout unset in production environments. Setting idle_in_transaction_session_timeout = '30s' or '60s' automatically aborts abandoned transactions, preserving overall cluster stability.▸3.3 Memory and CPU Contention Dynamics
Each PostgreSQL backend is an isolated Linux process. Evaluating its true memory consumption requires strictly differentiating shared memory pages from private process memory:
- 1Shared Memory and the Resident Set Size (RSS) Overcount:
- •Standard operating system inspection utilities (
ps,top) report Resident Set Size (RSS), which measures all physical RAM pages mapped into the process's virtual address space. - •A major portion of this RSS consists of
shared_buffers, shared lock tables, and shared dynamic libraries mapped across all backends. - •Consequently, summing the RSS of 500 backend processes grossly overcounts shared memory hundreds of times.
- •To assess actual per-process private memory, SREs must inspect /proc/[pid]/smaps for USS (Unique Set Size - physical RAM exclusive to that PID) and PSS (Proportional Set Size - USS plus a proportional fraction of shared pages).
- •An idle backend's baseline private memory (USS) typically ranges between 2–5 MB (scaling toward 5–10 MB as catalog caches and cached query plans accumulate).
- 1`work_mem` Is Allocated Per Operation Node, Not Per Query:
- •Contrary to widespread belief,
work_memis neither a fixed per-connection allocation nor a per-query ceiling. - •
work_memis allocated independently per operation node in the query execution tree. Furthermore, sorting and hashing operators adhere to distinct memory limits: - •Sort Operation Nodes (`Sort`, `Merge Join`): Allocate up to
work_mem. - •Hash Operation Nodes (`Hash Join`, `Hash Aggregate`): Scale with
hash_mem_multiplier, allocating up tohash_mem_multiplier * work_mem. - •Version-Dependent `hash_mem_multiplier` Defaults:
- •PostgreSQL 13 and 14: Default is
1.0(maintaining historic baseline behavior). - •PostgreSQL 15, 16, and 17+: Default was increased to
2.0(granting hash operators twice the baseline budget). - •Concrete Example (PG 15+ defaults): A query execution plan with 3 sort nodes (
Sort) and 2 hash joins (Hash Join) can allocate up to $3 \times \text{work_mem} + 2 \times (2.0 \times \text{work_mem}) = 7 \times \text{work_mem}$ concurrently (rather than $5 \times \text{work_mem}$). - •Parallel Query Scaling & Leader Participation: When parallel query execution is utilized (
max_parallel_workers_per_gather), each parallel worker process independently allocateswork_memfor the operators in its partial subplan. Crucially, becauseparallel_leader_participation = onby default in PostgreSQL, the coordinating leader backend process also participates in query execution and allocates its ownwork_mem. If a query with 4 parallel workers and an active leader (5 execution processes) executes 2 sort operations, peak memory demand can reach $(4 \text{ workers} + 1 \text{ leader}) \times 2 \times \text{work_mem} = 10 \times \text{work_mem}$. - •Unbounded concurrent allocations rapidly exhaust physical RAM and trigger the Linux Out-Of-Memory (OOM) Killer.
- •Kernel Context Switching & ProcArrayLock: On the CPU side, forcing hundreds of active processes onto a limited number of physical cores (e.g., 16 vCPU) shifts CPU utilization from query execution to kernel context switching and internal lightweight lock (LWLock, not spinlock) contention across
ProcArrayLock, which synchronizes global transaction state and snapshot acquisition (GetSnapshotData).
4. Capacity Boundaries: max_connections, Reserved Slots & Aggregated Demand
The absolute connection ceiling is governed by max_connections. However, this ceiling is not uniformly accessible to application roles.
+-----------------------------------------------------------------------------------+
|                           max_connections (Total Capacity)                        |
+----------------------------------------------------+------------------------------+
|            Effective Limit for Normal Roles        |        Reserved Capacity     |
|                                                    +---------------+--------------+
|   Application Clients, Poolers, Analytics          | pg_use_...    | SUPERUSER    |
|   (max_connections - reserved - superuser_reserved)| (PG 16+)      |              |
+----------------------------------------------------+---------------+--------------+▸4.1 Version-Specific Reserved Connection Slots
- 1`superuser_reserved_connections` (All Supported Versions, Default: 3):
- •Strictly reserved for roles with the
SUPERUSERattribute. - •Guarantees that when application connection slots are exhausted, database administrators can still authenticate via
psqlto diagnose and remediate outages.
- 1`reserved_connections` (Introduced in PostgreSQL 16, Default: 0):
- •Allocates dedicated slots for roles granted membership in
pg_use_reserved_connections. - •Designed for telemetry and monitoring agents (Prometheus
postgres_exporter, Datadog) so observability remains intact during connection saturation incidents without requiring superuser privileges. - •Handling in PostgreSQL 14 and 15: In PostgreSQL 14 and 15,
reserved_connectionsis absent. Predefined roles such aspg_monitororpg_read_all_statspermit telemetry inspection but do NOT grant access tosuperuser_reserved_connections. Rather than violating least privilege by granting monitoring agentsSUPERUSER, operators must explicitly budget telemetry slots inside the normal connection quota (max_connections - superuser_reserved_connections), for instance by bounding application connection pools or enforcingCONNECTION LIMITon application roles.
The effective normal role limit available to standard application users is calculated as:
In a cluster configured with max_connections = 50, superuser_reserved_connections = 3, and reserved_connections = 2, normal application roles have an upper bound of exactly 45 slots. The 46th concurrent client request is rejected by the engine.
idle_in_transaction_session_timeout, idle_session_timeout, and tcp_keepalives_idle are not universal silver bullets; they are conditional operational examples that must be calibrated to transaction profiles, long-running reporting queries, and cloud network topologies. (In PostgreSQL 14 and 15, reserved_connections is absent; monitoring connections must be provisioned within the normal connection budget and safeguarded via application pool bounds or role-level CONNECTION LIMIT).FATAL: sorry, too many clients already or remaining connection slots are reserved for roles with the SUPERUSER or REPLICATION attribute, consult the PostgreSQL Connection Exhaustion & too many clients Triage Runbook for non-blocking diagnostic and safe mitigation procedures.5. Two-Tier Pooling Architecture: Application Pools and PgBouncer
Achieving scalable connection management requires a two-tier pooling architecture, combining client-side local pools with an upstream proxy multiplexer.
▸5.1 Division of Responsibilities Across Tiers
| Architecture Tier | Tier 1: Client Application Pool | Tier 2: Server-Side Multiplexer (PgBouncer) |
|---|---|---|
| Common Implementations | HikariCP (Java), pg-pool (Node.js), asyncpg (Python), sqlx (Rust/Go) | PgBouncer, pgcat, Odyssey |
| Deployment Location | Inside application containers / pods | Independent proxy container, sidecar, or VM |
| Primary Problem Solved | Eliminates per-request TCP/TLS handshake and authentication overhead by reusing pre-established pool connections (transport and encryption remain, but connection setup is amortized). | Multiplexes thousands of client connections onto a constrained set of PostgreSQL workers. |
| Scaling Bottleneck | As pods scale horizontally (e.g., 100 pods $\times$ 15 connections), opens 1,500 sockets to the database. | Condenses those 1,500 sockets onto 25–40 physical PostgreSQL backend processes. |
▸5.2 PgBouncer Operational Modes: Session vs. Transaction
- 1Session Mode: Allocates a dedicated PostgreSQL backend upon client connection and maintains that binding until the client explicitly disconnects. Provides no multiplexing benefit; merely caches authentication handshakes.
- 2Transaction Mode (Recommended Standard): Binds a client to a PostgreSQL backend solely for the active duration of an individual transaction (
BEGIN...COMMIT). The moment the transaction concludes, the backend is released back to the shared pool. - 3Statement Mode: Releases the backend after every individual SQL statement. Does not support multi-statement transaction blocks; rarely used outside purely analytical read workloads.
▸5.3 Transaction Mode Constraints and Official Documentation Rules
When adopting transaction pooling (pool_mode = transaction), because the backend process is released immediately upon transaction completion (COMMIT / ROLLBACK), strict session state boundaries apply:
- 1`SET` Commands & Session GUCs (`SET LOCAL` Is Mandatory):
- •Standard
SETstatements mutate backend state, leaking configuration into subsequent transactions. - •PgBouncer tracks and synchronizes only select startup parameters (
client_encoding,datestyle,timezone,standard_conforming_strings,application_name). - •All other custom transaction parameters must use `SET LOCAL`, which automatically reverts at transaction end.
- 1Temporary Tables (`TEMP TABLE` Lifecycle Boundaries):
- •`ON COMMIT DROP` (Supported in Transaction Mode): Temporary tables declared with
CREATE TEMP TABLE ... ON COMMIT DROPare dropped automatically by PostgreSQL at the end of the transaction block (COMMITorROLLBACK). Because the table's lifecycle is strictly bounded by the transaction, the backend process is returned completely clean to the pool, making this pattern fully supported in transaction pooling (pool_mode = transaction). - •`PRESERVE ROWS` / `DELETE ROWS` (Requires Session Mode): Default temporary tables (
ON COMMIT PRESERVE ROWS) andON COMMIT DELETE ROWSpersist across transactions until the physical backend connection disconnects. In transaction pooling, when another client borrows the backend, schema pollution and name collision occur. Workloads requiring session-scoped temporary tables must be routed to dedicated session-mode pools or unpooled connections.
- 1`LISTEN / NOTIFY` Distinction:
- •
LISTENregisters a persistent asynchronous socket listener in the backend and fails in transaction mode (requires session mode). - •In contrast,
NOTIFYis fully transactional and functions cleanly in transaction mode.
- 1Prepared Statements and PgBouncer 1.21+ Support:
- •SQL Syntax (`PREPARE stmt AS ...`): Bound to the backend process session memory and is strictly unsupported in transaction mode.
- •Protocol Level (Supported in PgBouncer 1.21+): Extended Query Protocol (
Parse,Bind,Execute) prepared statements are transparently supported in PgBouncer 1.21+ viamax_prepared_statements.
6. Empirical Laboratory Findings and Performance Metrics
The architectural principles outlined in this guide were verified in an isolated container laboratory running PostgreSQL 17.11 and PgBouncer 1.26.1 under an extended query protocol transactional workload (Evidence and timestamped raw JSON samples are preserved in c:/myprojects/dbaguide/.local/notion-outbox/2026-10-28-EDITORIAL-001/connection-lab-evidence.json):
- •Execution Run ID:
conn-lab-1793279798238 - •Verified Image Digests & Exact Versions:
- •PostgreSQL:
postgres:17-alpine@sha256:266d3c257594e195b309ae9d1805e54c788f1d7b375f56bf6c367aac6c917e7b(PostgreSQL 17.11 on x86_64-pc-linux-musl) - •PgBouncer:
edoburu/pgbouncer:latest@sha256:8638aa563607256d3c7440437534195f1066a92b68015d89ae9d6b935b444a6d(PgBouncer 1.26.1) - •Verified Engine Bounds:
SHOW max_connections = 50,superuser_reserved = 3,reserved = 2$\to$ Effective Limit: 45. - •Sampling Methodology & Duration: Backend process counts were sampled at 50 ms intervals during workload execution (
peakActiveBackends), followed by an immediate post-load snapshot. Test runs were short-burst executions under 1–2 seconds. - •Workload & Request Concurrency: Scenarios evaluated distinct architectural boundaries (saturation rejection, pool queuing, proxy multiplexing, and rolling drain) across varying client request volumes (60, 60, 120, and 80 requests).
- •Scope & Limitations: This benchmark does not claim universal performance superiority or validate every production deployment under arbitrary workloads; it demonstrates queuing, rejection under
max_connections, and graceful pool draining in a controlled test harness.
▸6.1 Four Measured Architectural Scenarios
| Metric / Observation | 1. Direct Unpooled Connections | 2. Client Pool (Pool max=20) | 3. Two-Tier (App Pool + PgBouncer) | 4. Rolling Drain (Dual Poolers) |
|---|---|---|---|---|
| Target Port | 55450 (Direct PostgreSQL) | 55450 (Direct PostgreSQL) | 55451 (PgBouncer Proxy) | 55451 (PgBouncer Proxy) |
| Concurrency | 60 unpooled clients | 60 worker requests | 120 worker requests | 80 workers (40 old + 40 new) |
| Successful Transactions | 44 | 60 | 120 | 80 |
| Rejections / Errors | 16 (26.7% rejection) | 0 (0% rejection) | 0 (0% rejection) | 0 (0% rejection) |
| Error Code | 53300 (remaining slots reserved) | None (Worker queue wait) | None (Proxy multiplexed) | None (Graceful pool drain) |
| Peak Backend Processes | 45 (44 app + 1 admin) | 21 (20 app + 1 admin) | 16 (15 app + 1 admin) | 16 (15 app + 1 admin) |
| Connection Latency | p50: 9ms · p99: 13ms | *Unmeasured/Amortized (null)*¹ | *Unmeasured/Amortized (null)*¹ | *Unmeasured/Amortized (null)*¹ |
| Pool Queue Wait Time | *No Pool (null)*² | p50: 54ms · p99: 69ms | p50: 56ms · p99: 163ms | p50: 87ms · p99: 114ms |
| Statement Duration | p50: 6ms · p99: 10ms | p50: 11ms · p99: 29ms | p50: 70ms · p99: 121ms | p50: 57ms · p99: 75ms |
| Recovery / Drain Time | 0.141 seconds | 0.125 seconds | 0.010 seconds | 0.009 seconds |
*Table Notes:* ¹ *Unmeasured / Amortized (null):* Client workers checkout connections from pre-warmed pools; TCP/TLS handshake latency is amortized and was not isolated as a discrete metric. Acquisition queue delay is captured separately as poolWaitMs. ² *No Pool (null):* Direct connection scenario does not utilize a client connection pool; pool queue wait is not applicable.
▸6.2 The 132/82 Multi-Pooler Capacity Model
Our validated multi-pooler capacity model examines a realistic microservice architecture:
- •Configuration: 2 PgBouncer instances ($K=2$), each hosting 2 Databases $\times$ 2 Users (4 independent pools),
default_pool_size = 15,max_db_connections = 35, andmax_user_connections = 30. - •Single Pooler Ceiling: $\min(4 \times 15, 2 \times 30, 2 \times 35) = 60$ backends.
- •Dual Pooler Ceiling: $2 \times 60 = 120$ backends.
- •Direct Administrative / Migration / Monitoring Workloads: 12 backends.
- •Calculated Capacity Budget Ceiling: $120 + 12 = 132$ backends.
max_connections = 50, this ceiling reveals a planned capacity deficit of 82 slots. Preventing production exhaustion requires configuring strict max_db_connections and max_user_connections guardrails on both PgBouncer instances.7. Production Configuration Baselines and Reference SQL Queries
▸7.1 PostgreSQL Server Configuration Baseline (`postgresql.conf`)
Recommended parameters for an 8–16 vCPU OLTP production database:
# =====================================================================
# PostgreSQL Connection & Memory Configuration Baseline
# =====================================================================

# 1. Connection Limits
max_connections = 100                     # Calibrate to CPU core count and I/O profile
superuser_reserved_connections = 3        # Emergency administrator access
reserved_connections = 2                  # PG 16+: Dedicated telemetry/monitoring slots (unsupported in PG 14/15)

# 2. Session Timeouts & Connection Health
idle_in_transaction_session_timeout = 30s # Terminate abandoned transactions after 30s
statement_timeout = 30s                   # Abort runaway statements holding locks
tcp_keepalives_idle = 60                  # Detect dead client sockets after 60s
tcp_keepalives_interval = 10              # Probe every 10s
tcp_keepalives_count = 3                  # Drop socket after 3 failed probes

# 3. Memory Bounds
shared_buffers = 4GB                      # 25% of total RAM on a 16 GB instance
work_mem = 16MB                           # Maximum memory per query execution operation node
maintenance_work_mem = 512MB # VACUUM and index creation allocation▸7.2 PgBouncer Configuration Baseline (`pgbouncer.ini`)
[databases]
app_db = host=127.0.0.1 port=5432 dbname=app_db pool_size=20 max_db_connections=35

[pgbouncer]
listen_addr = 0.0.0.0
listen_port = 6432
auth_type = scram-sha-256
auth_file = /etc/pgbouncer/userlist.txt

# Pooling Strategy
pool_mode = transaction                   # Maximum multiplexing efficiency
default_pool_size = 15                    # Baseline backend ceiling per (db, user)
min_pool_size = 5                         # Minimum warm connections kept open
reserve_pool_size = 5                     # Emergency headroom for traffic surges
reserve_pool_timeout = 3                  # Activate reserve pool after 3s queue wait

# PgBouncer 1.21+ Prepared Statement Management
max_prepared_statements = 100             # Protocol-level prepared statement tracking

# Timeouts
server_idle_timeout = 600                 # Close unused backend connections after 10m
client_idle_timeout = 0                   # Do not drop client sockets; app pools manage idle
query_timeout = 120 # Terminate queries exceeding 2 minutes▸7.3 Diagnostic Telemetry Queries
-- 1. Detailed Session States and Wait Events
SELECT
    pid,
    usename,
    client_addr,
    state,
    wait_event_type,
    wait_event,
    now() - state_change AS state_age,
    now() - xact_start AS xact_age,
    left(query, 60) AS query_sample
FROM pg_stat_activity
WHERE backend_type = 'client backend'
ORDER BY xact_age DESC NULLS LAST
LIMIT 10;

-- 2. Detect Long-Running Idle Transactions
SELECT
    pid,
    usename,
    now() - state_change AS idle_duration,
    query
FROM pg_stat_activity
WHERE state = 'idle in transaction'
  AND (now() - state_change) > interval '10 seconds';
8. Production Architecture Evaluation Checklist
Review this 10-point rubric to evaluate your PostgreSQL connection architecture:
- max_connections Calibration: Empirically sized and verified against physical/vCPU core capacity, I/O profile, and concurrent active transaction demand rather than arbitrary thread counts?
- Reserved Slot Budgeting: Dedicated slots provisioned for emergency DBA remediation (
superuser_reserved_connections) and telemetry/monitoring according to engine version (PG 16+reserved_connectionsor dedicated allocation within the normal quota in PG 14/15)? - Idle Transaction Timeout:
idle_in_transaction_session_timeoutenforced (15s–60s) to prevent transaction table bloat? - Client Pool Sizing: Aggregated connection demand across all horizontal pods calculated against available database backend capacity?
- Pooler Mode Selection: High-concurrency services routed through PgBouncer in
transactionmode? - Prepared Statement Compatibility:
max_prepared_statementsconfigured if running PgBouncer 1.21+; driver statement pooling verified? - Pool Multiplier Guardrails: Multi-tenant or multi-database deployments constrained via
max_db_connectionsandmax_user_connections? - TCP Keepalive Calibration: Aggressive keepalive probes (
60s / 10s / 3) configured to drop dead TCP sockets? - Statement Timeouts: Global or role-based
statement_timeoutestablished to prevent unindexed queries from holding row locks indefinitely? - Telemetry Role Isolation: Prometheus / monitoring agents granted
pg_use_reserved_connectionsto maintain observability during connection saturation incidents?
9. Related Error Guide & Triad Siblings
▸Related Diagnostic Runbook
*Emergency read-only pg_stat_activity diagnostics, active/idle/idle-in-transaction isolation, PG 16 reserved slots, and operator-approved backend termination.*
▸Triad Sibling Publications (dataiotech Ecosystem)
*HikariCP vs. PgBouncer architectural evaluation, two-tier pooling, session vs. transaction mode tradeoffs, and prepared statement boundaries.*
- •dataopsphere: Protecting Connection Budgets During Application Scaling
*Mathematical capacity formulas, Kubernetes rolling deployment 100% surge multiplier, truncated exponential backoff with full jitter, and SRE incident response card.*
10. References and Official Documentation
- •PostgreSQL Documentation — Connections and Authentication (Runtime Config)
- •PostgreSQL Documentation — Managing Kernel Resources
- •PostgreSQL Documentation — pg_stat_activity View
- •PostgreSQL 16 Release Notes — reserved_connections Feature
- •PgBouncer Official Documentation — Configuration & Features
- •PgBouncer GitHub Repository — Release 1.21.0 Prepared Statements Support
Complementary Ecosystem Content: PostgreSQL Connection Capacity & Connection Pooling: Triage, Tool Selection & SRE Capacity Budget
Complementary dataiotech publications covering this problem from different angles (diagnostics, tooling, escalation):
Which Need Does PgBouncer Solve Alongside Application Pools?
Application pools and PgBouncer are complementary. Mode constraints, prepared statements, and session state management.
Protecting Connection Budgets During Application Scaling
Mathematical backend budget formula as app instances scale, rolling deployment surge management, exponential backoff, and on-call runbook.
Other PostgreSQL Guides
Verified operational assets for this database engine.
Verify Your PostgreSQL Backup: The First Restore Drill
A successful backup job only proves a file was written. This runbook executes an end-to-end restore and data validation drill in an isolated staging environment.
PostgreSQL Replication Lag: Step-by-Step Bottleneck Diagnosis
When a replica falls behind, is the bottleneck in WAL generation, network transport, or replay contention? Pinpoint the exact layer with read-only triage queries.
psql CLI Quick Reference
Connection parameters, meta commands (\d, \l, \du), .psqlrc template, COPY streaming, and real-time lock/activity triage queries.