
PostgreSQL Replication Lag: Step-by-Step Bottleneck Diagnosis
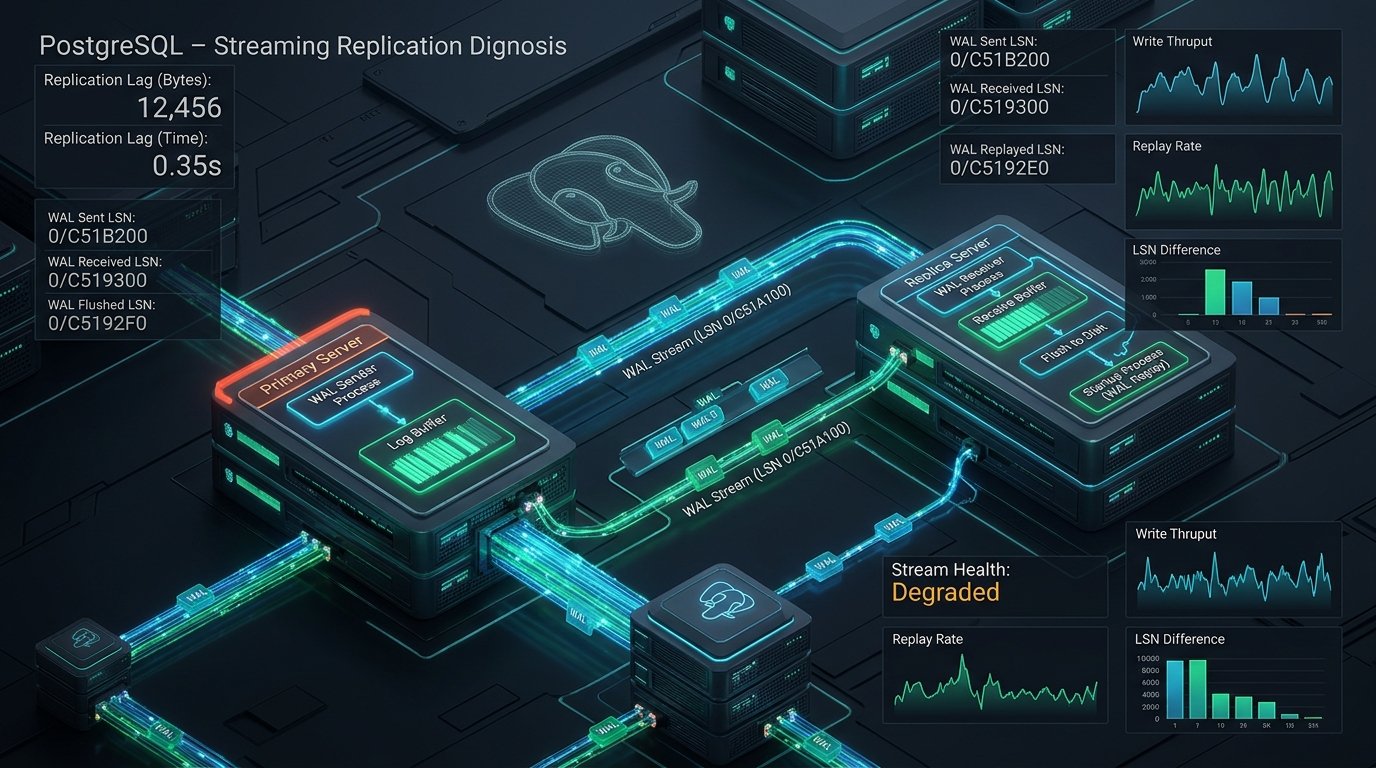
Replica falling behind? Is the bottleneck in WAL generation, sending, network transfer, or replay? Identify the exact stage where replication lag accumulates using safe, read-only diagnostics.
▸Summary
Replica falling behind? Is the bottleneck in WAL generation, sending, network transfer, or replay? Identify the exact stage where replication lag accumulates using safe, read-only diagnostics.
Replication lag is not a root cause on its own. It is a symptom that can accompany stale user reads, outdated reports, or degraded recovery readiness. The first step is not guessing parameters, but establishing the topology and locating where the lag accumulates.
The fact that a replica is connected to the primary does not mean it applies changes at the same rate. Similarly, seeing a high "lag seconds" metric on a monitoring panel does not prove replication has halted.
Separate three core questions for proper diagnosis:
- 1Is connection active? Is the expected standby connected to the correct upstream host?
- 2Is WAL progressing? Are sent, written, flushed, and replayed locations advancing?
- 3Is business service impacted? Does the replica provide sufficiently fresh data for its intended workload?
This guide focuses on PostgreSQL physical streaming replication and direct primary-standby connections. Logical replication requires separate assessment. In cascading setups, each replication link must be evaluated individually.
▸Separate the Concepts: Accumulation, Latency, and Data Freshness
"Replication lag" can refer to multiple distinct measurements:
| Concept | Question Answered | What It Cannot Tell Alone |
|---|---|---|
| WAL position difference | How many bytes of WAL separate the two stages? | How many transactions behind or when catch-up occurs |
write_lag, flush_lag, replay_lag | How long did it take recent WAL to reach each stage and report back? | How long current accumulation will take to clear |
| Age of last replayed transaction | How old is the last replayed transaction compared to primary wall clock? | Whether new transactions are even being generated on primary |
| Application data freshness | Are required changes visible on the application read path? | Which technical stage holds the bottleneck |
These measurements are complementary, not interchangeable. For instance, if no new transactions occur on the primary, the last replay timestamp remains static; yet the replica may have fully applied all available WAL.
▸Record Context First
- •PostgreSQL major version and monitoring tool release.
- •Connection path between primary and standby, including any intermediate replicas.
- •Synchronous vs asynchronous mode, intentional delay policy (
recovery_min_apply_delay). - •Replica role: reporting, read-scaling traffic, or failover candidate.
- •Incident start time and concurrent events like batch updates or maintenance.
Documenting this at the outset is critical. The exact same metric carries different meanings across topologies. An intentionally delayed reporting replica cannot be evaluated with the same threshold as a read replica serving low-latency customer reads.
All queries are strictly read-only. View and function visibility depend on your role and cloud provider. Use a least-privilege monitoring account; do not grant superuser merely to run diagnostics. Examples reflect PostgreSQL 18 documentation.
▸Stage 1 — Which Server Are You On?
Execute on primary and standby separately:
SELECT clock_timestamp() AS sampled_at,
       current_setting('server_version') AS server_version,
       pg_is_in_recovery() AS in_recovery;
On a normal physical standby, recovery status must be true. An unexpected result indicates an unverified role change or incorrect routing.
Never assume server roles, especially when connecting via connection poolers, service endpoints, or post-failover DNS records. Believing you connected to a standby does not prove queries are actually running on one.
Output of this stage: Sampling timestamp, PostgreSQL version, and verified server role.
▸Stage 2 — Primary Connection & WAL Positions
Run on primary only:
SELECT clock_timestamp() AS sampled_at,
       application_name,
       state,
       sync_state,
       sent_lsn,
       write_lsn,
       flush_lsn,
       replay_lsn,
       pg_wal_lsn_diff(pg_current_wal_lsn(), sent_lsn)
         AS current_to_sent_bytes,
       pg_wal_lsn_diff(sent_lsn, write_lsn)
         AS sent_to_write_bytes,
       pg_wal_lsn_diff(write_lsn, flush_lsn)
         AS write_to_flush_bytes,
       pg_wal_lsn_diff(flush_lsn, replay_lsn)
         AS flush_to_replay_bytes,
       write_lag,
       flush_lag,
       replay_lag
FROM pg_stat_replication;
LSN represents a position in the WAL stream. Differences are in bytes, not rows or transactions. These fields reflect positions reported back by the standby; a single point-in-time snapshot is not proof of root cause. Lag durations are also not catch-up ETAs. On an idle, fully caught-up cluster, lag intervals may be NULL. Never blindly treat NULL as zero or as a catastrophic failure.
Important detail: pg_current_wal_lsn() returns the primary's current WAL write position; it is not identical to WAL insertion or disk flush positions. Treat current_to_sent_bytes as the delta between write position and sender position, not an absolute tally of all generated WAL.
Furthermore, pg_stat_replication only displays directly connected standbys. A downstream replica missing from this result set may be connected to an intermediate standby in a cascading topology.
How to interpret findings:
| Repeated Observation | Diagnostic Direction (Not Definitive Cause) |
|---|---|
| Expected replica row missing | Connection, service status, topology, or authentication |
| current_to_sent delta growing | WAL generation rate, sender process capacity, or backpressure |
| sent_to_write delta growing | Network path, receiver capacity, or standby disk write performance |
| write_to_flush delta growing | Standby storage flush latency |
| flush_to_replay delta growing | Replay progression, resource contention, or recovery conflicts |
Collect a short time series rather than relying on a single snapshot. Avoid confusing write spikes with apply stalls. To avoid transaction snapshot distortions, execute samples as distinct autocommit queries.
Evaluate trend direction across the time series:
- •Delta growing: The stage cannot keep pace with incoming WAL during the observation window.
- •Delta shrinking: The replica is catching up; catch-up is not yet complete.
- •Delta static: Indicates steady lag, balanced throughput, or stalled LSNs. Examine the raw LSN values directly.
- •Row vanishes: The connection or monitoring scrape dropped; do not interpret as zero lag.
A streaming state alone does not imply zero lag. Correlate connection state with WAL byte deltas.
▸Stage 3 — Standby Replay Progression
Run on standby only:
SELECT clock_timestamp() AS sampled_at,
       pg_last_wal_receive_lsn() AS received_lsn,
       pg_last_wal_replay_lsn() AS replayed_lsn,
       pg_wal_lsn_diff(pg_last_wal_receive_lsn(),
                    pg_last_wal_replay_lsn())
         AS received_to_replayed_bytes,
       pg_is_wal_replay_paused() AS replay_paused,
       pg_last_xact_replay_timestamp() AS last_replayed_xact_at;
The timestamp of the last replayed transaction is not identical to replication lag: if no new transactions commit on the primary, this timestamp remains unchanged. Similarly, the receive-to-replay delta does not capture total lag if WAL has not yet arrived on the standby.
If replay is paused, determine whether it was intentional before unpausing. Never issue an uncoordinated resume. Do not evaluate intentionally delayed standbys against standard replication SLAs.
Technical note on pause states: pg_is_wal_replay_paused() indicates whether a pause request has been submitted. When verifying whether replay has actually halted, check pg_get_wal_replay_pause_state(). Requesting a pause and replay being fully stopped are distinct states.
The received_lsn value is not a generic socket counter: it returns the latest WAL position received via streaming replication and synchronized to disk. If streaming has not started or is inactive, it returns NULL.
Because primary and standby samples are not captured atomically, record timestamps for each sample. Never treat cross-host readings as an atomic snapshot.
▸Stage 4 — Validate Hypothesis with Secondary Evidence
- •Suspected network issue: inspect packet drops, retransmissions, throughput, and socket drops.
- •Suspected storage issue: compare standby disk latency, IOPS, queue depth, and free capacity.
- •Suspected replay bottleneck: review PostgreSQL logs, recovery conflict cancellations, and heavy analytical queries.
- •Suspected WAL burst: correlate batch jobs and application schema migrations against timestamp curves.
- •Physical replication slots: monitor retained WAL bytes and primary filesystem capacity risks.
Secondary evidence should challenge your initial hypothesis, not merely reinforce confirmation bias.
| Initial Hypothesis | Corroborating Evidence | Alternative to Test |
|---|---|---|
| Network bottleneck | Network retransmits and socket resets | Standby unable to write WAL to disk fast enough |
| Standby storage slow | Elevated disk service time and flush queues | CPU/memory exhaustion throttling replay worker |
| Analytical queries blocking replay | Recovery conflicts (recovery_conflict) in logs | Host-level I/O saturation starving both queries and replay |
| Sudden WAL surge | Write batch coinciding with lag onset | Concurrent drop in standby compute capacity |
A long-running reporting query does not automatically prove replay is blocked. Distinguish general resource contention from true recovery lock conflicts. Query cancellation counts alone do not directly measure lock wait durations.
Deleting replication slots, removing WAL files manually, terminating sessions, or initiating failover are not routine next steps; each requires separate operational approval.
▸Worked Interpretation Example
Suppose repeated samples reveal small sent_to_write deltas, but a growing flush_to_replay gap. Concurrently, standby disk latency spikes. This justifies focusing on the replay/storage pipeline, but does not prove disk hardware failure on its own.
Proceed through this sequence:
- 1Confirm telemetry is fresh and describes the exact same replica.
- 2Determine whether replay is completely halted or progressing slowly.
- 3Rule out intentional pauses (
recovery_min_apply_delay). - 4Compare disk latency, CPU utilization, reporting queries, and recovery logs over the same window.
- 5If executing a reversible intervention, record before/after trends immediately.
Lag reduction following an intervention suggests the action was beneficial, but concurrent external changes (such as a batch job ending) must be ruled out before declaring root cause.
▸Common Diagnostic Traps
- •Treating last replayed transaction age as actual lag: Misleading on idle systems.
- •Converting NULL lag values to zero: Masks disconnected or unknown cluster states as healthy.
- •Looking only at standby receive-to-replay deltas: Hides WAL backed up on the primary or network.
- •Assuming connected replicas equal expected replicas: Vanished standbys are invisible without an inventory baseline.
- •Restarting nodes as first response: Destroys telemetry evidence and introduces unneeded downtime.
- •Conflating replay backlog with data loss: Distinguish WAL received and flushed from WAL never transmitted.
▸What You Should Have When Diagnosis Concludes
A rigorous diagnostic log documents:
- •Impacted replica and verified topology role.
- •Time window of observed degradation.
- •Specific pipeline stage holding the accumulation.
- •Evidence supporting and challenging this finding.
- •Customer and infrastructure impact on primary and standby.
- •Applied mitigations and verified recovery curves.
- •Confirmed root cause or explicit open investigation items.
▸Sources & References
- •PostgreSQL 18 — Monitoring Statistics
- •PostgreSQL 18 — System Administration Functions
- •PostgreSQL 18 — Log-Shipping Standby Servers / Streaming Replication
▸Replication Health Cross-Site Links
- •For monitoring tools evaluation & checklist: Replication Lag Monitoring: What to Look for in Tools
- •For on-call incident response runbook: From Replication Lag Alert to Incident Response
Share Your Replication Lag & Architecture Experience
Contribute real-world replication topology, bottleneck stages (WAL, network, disk, replay locks), and observability telemetry to help build engineering benchmarks.
Complementary Ecosystem Content: PostgreSQL Replication Lag: Diagnostics, Tooling Evaluation & Incident Escalation
Complementary dataiotech publications covering this problem from different angles (diagnostics, tooling, escalation):
Replication Lag Monitoring: What to Look for in Tools?
postgres_exporter vs Percona PMM: Telemetry reliability, idle system metrics, and pilot evaluation rubric.
From Replication Lag Alert to Incident Response
7-step on-call response protocol, pre-filled service scorecard, business impact matrix, and postmortem tracking.